Table Of Contents


You don’t need to be a finance expert to make sense of accounting data. With the right ratios, even complex financial reports can become much easier to understand. That’s where Accounting Ratios come in; they help you quickly spot what’s working and what needs attention.
In this blog, we’ll explore what Accounting Ratios are, why they’re essential, the key types you should know, and how they can transform the way you view financial information. Together, let’s break down the numbers and simplify finance, one ratio at a time.
Table of Contents
- What is an Accounting Ratio?
- Why are Accounting Ratios Important?
- Types of Accounting Ratios
- Benefits of Accounting Ratio Analysis
- Drawbacks of Ratio Analysis
- Conclusion
What is an Accounting Ratio?
An accounting ratio is a mathematical comparison between two financial figures drawn from a company’s financial statements, primarily the income statement, balance sheet, or cash flow statement. These ratios, grounded in fundamental Accounting Concepts, are used to analyse a company’s financial health by measuring profitability, liquidity, operational efficiency, and solvency.
They provide a quick, reliable way to interpret financial data and track performance over time. By distilling complex figures into clear benchmarks, they support better financial decision-making for investors, analysts, and managers.
Types of Accounting Ratios
Different ratios reveal different sides of a business. Let’s explore the main categories:

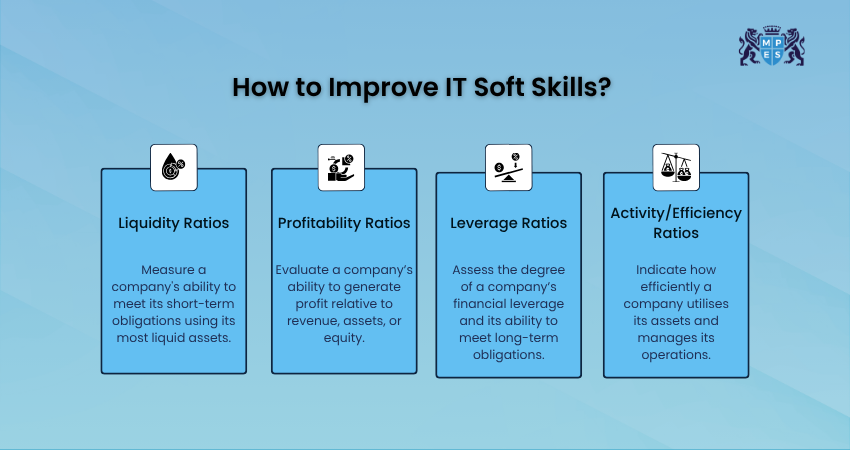
1. Liquidity Ratios
Liquidity ratios measure a company’s ability to meet short-term financial obligations. Low values may signal cash flow issues, while excessively high values could indicate inefficient use of working capital. Common examples include:
Current Ratio = Current Assets / Current Liabilities: Indicates whether the company has enough assets to cover short-term debts. A ratio below 1 could mean financial trouble; above 2 may signal under-utilised assets.
Quick Ratio (Acid-Test) = (Current Assets – Inventory) / Current Liabilities: A more stringent measure that excludes inventory, focusing on the most liquid assets. It’s useful when inventory is hard to convert quickly into cash.
Why it Matters: Low Liquidity Ratios signal cash flow problems, while high ratios may suggest inefficiency in using working capital.
2. Profitability Ratios
These ratios tell you how profitable, efficient, and investor-friendly the business is. They measure how well it converts revenue into profit:
Net Profit Margin = Net Profit / Revenue: Shows how much profit is earned from each dollar of sales. Higher margins indicate better cost control and profitability.
Return on Assets (ROA) = Net Income / Total Assets: Reflects how efficiently a company uses its assets to generate earnings.
Return on Equity (ROE) = Net Income / Shareholders’ Equity: Measures the return generated on the investment made by shareholders. A high ROE is attractive to investors.
Why it Matters: Profitability Ratios reveal operational strength and long-term sustainability.
3. Leverage Ratios
They help assess the company’s risk level and ability to meet long-term obligations. They show how much of the business is financed through debt versus equity. High debt can be risky:
Debt-to-Equity Ratio = Total Debt / Shareholders’ Equity: Indicates how much debt is used for every unit of equity. High ratios may suggest financial risk, especially in downturns.
Interest Coverage Ratio = EBIT / Interest Expense: Measures how easily the company can pay interest on its debt. A low ratio indicates potential difficulty in meeting debt obligations.
Why it Matters: These ratios are crucial for lenders and investors assessing the company’s long-term financial stability.
Your shortcut to boardroom confidence - CIMA Fundamentals of Management Accounting (BA2) Training awaits!
4. Activity/Efficiency Ratios
These focus on how effectively a company uses its resources to generate revenue. The higher the turnover, the more efficiently the business is operated.
Inventory Turnover = Cost of Goods Sold / Average Inventory: Shows how many times inventory is sold and replaced over a period. Low turnover could mean overstocking; high turnover shows good sales or efficient inventory use.
Asset Turnover = Net Sales / Average Total Assets: Indicates how effectively a company uses its entire assets to generate revenue. Higher turnover means better use of resources.
Why it Matters: These ratios help identify productivity and efficiency gaps in operations and resource utilisation.
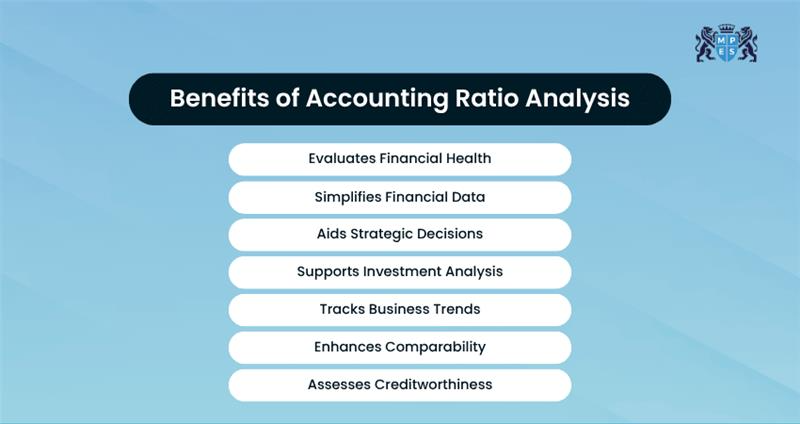
Benefits of Accounting Ratio Analysis
It’s a vital tool for businesses, investors, and creditors to understand performance and make informed decisions. Here are the key benefits:

Evaluate Financial Health: Helps to assess profitability, liquidity, solvency, and efficiency. It provides a clear picture of a company’s overall financial situation.
Simplifies Financial Data: They translate financial statements into understandable metrics, making it easier to interpret and compare performance.
Aids Strategic Decisions: Management uses ratios to identify trends, improve operations, and guide budgeting and planning efforts.
Supports Investment Analysis: Investors rely on ratios like P/E and ROE to evaluate company value and risk when comparing investment options.
Tracks Business Trends: Monitoring ratios over time reveals patterns and helps forecast future performance or flag potential issues early.
Enhances Comparability: Ratios allow businesses to benchmark against industry standards or competitors to evaluate relative performance.
Assesses Creditworthiness: Lenders use ratios to judge a company’s ability to repay debt, manage liabilities, and maintain financial stability.
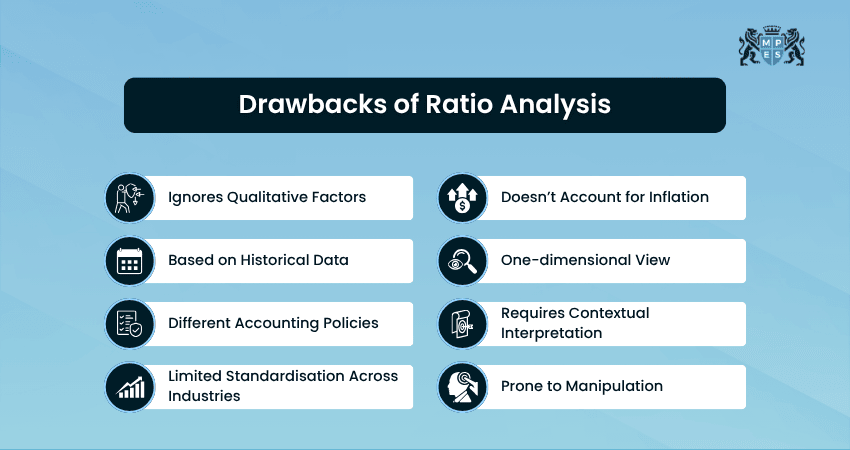
Drawbacks of Ratio Analysis
Before diving into business decisions, it's essential to understand both the strengths and limitations of accounting ratio analysis. While these ratios provide valuable insights into a company's financial health, they aren't foolproof.

Ignores Qualitative Factors: Ratios focus strictly on numerical data and overlook non-financial aspects like employee morale, brand value, customer satisfaction, or market reputation.
Based on Historical Data: Ratio analysis uses past financial statements, which may not reflect current conditions or future potential.
Different Accounting Policies: Companies may employ different accounting methods, which can distort ratio comparisons across firms and lead to inaccurate benchmarking.
Limited Standardisation Across Industries: There are no universally accepted “ideal” ratios. What’s healthy for one industry may be a red flag in another.
Doesn’t Account for Inflation: Ratios are typically calculated using historical costs. In times of inflation, these figures may understate asset values or overstate profit.
One-dimensional View: A single ratio rarely gives the full picture. Overreliance on one or two ratios can cause users to miss important financial red flags.
Requires Contextual Interpretation: Ratios need to be interpreted in context. A high current ratio might signal good liquidity or poor asset utilisation, depending on the situation.
Prone to Manipulation: Management may engage in “window dressing” to make financial ratios appear healthier.
Conclusion
Accounting Ratios offer a powerful way to decode financial statements, enabling smarter decisions for investors, managers, and analysts. They provide valuable insights into profitability, liquidity, and risk. However, these ratios must be interpreted with context and caution, as they may rely on outdated data or be manipulated. Combining ratio analysis with qualitative judgment leads to more reliable financial decisions.
Fuel your finance flair with our CIMA Fundamentals of Business Economics (BA1) Course - Earn your competitive edge now!
 Have Any Question?
 +44 7452 122728


 Back
Back


 44 7452 122728


