Have Any Question?
 +44 7452 122728


 Back
Back


What is Descriptive Analytics? Process, Benefits and Examples
Descriptive Analytics is the process of analysing historical data to understand what has happened in a business or process and identify trends and patterns. The insights are usually presented through reports, charts, or dashboards for easy understanding. This helps organisations track performance and make more informed decisions.Table Of Contents


 44 7452 122728
 01-May-2026
Author-Gary Moore
You check your sales numbers, website traffic, and reports regularly, but do you truly understand what they mean? Many businesses collect and review data every day, yet struggle to turn it into useful insights. This is where Descriptive Analytics comes in.
It helps interpret your data by organising and presenting it in a simple and meaningful way. Instead of guessing, you can clearly see what has happened in your business. In this blog, we will explore what is Descriptive Analytics, how it works, its benefits and real-world examples to help you use your data effectively. Let's get started!
What is Descriptive Analytics?
Descriptive Analytics focuses on examining historical data to identify what has occurred in a business, system or process. Rather than predicting the future or explaining causes in depth, it provides a clear summary of past events using data aggregation, reporting and visualisation techniques.
Descriptive Analytics is often considered the foundation of Data Analysis. It answers common questions like “How much did we sell?” or “What was our performance last month?” By providing a clear view of past activities, it supports better decision-making and helps businesses improve their strategies.

How Descriptive Analytics Works?
Descriptive Analytics works by collecting historical data, organising it and presenting it in a way that is easy to understand. The process involves summarising large datasets into smaller, more manageable insights using tools such as spreadsheets, Business Intelligence (BI) platforms and reporting software.
What does Descriptive Analytics Tell You?
Descriptive Analytics provides a snapshot of past performance. It tells you what has already happened in your business. This helps organisations understand key trends, patterns, and outcomes based on historical data.
For example, it can reveal which products sold the most, which marketing campaigns performed best, or which time periods experienced higher customer engagement.
The Descriptive Analytics Process Step-by-Step
The Descriptive Analytics process follows a clear set of steps that turn raw data into useful insights. Below are the steps involved:
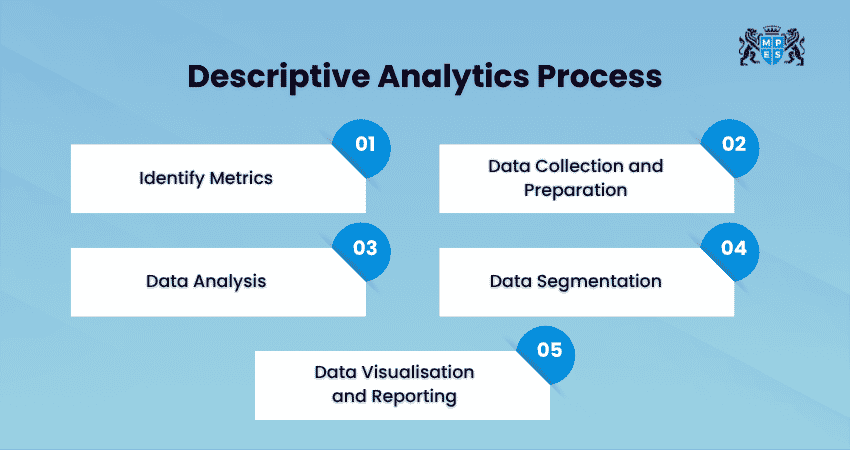
1) Identify Metrics
The first step in Descriptive Analytics is deciding what you want to measure. These measurements, known as metrics, should align with business goals and provide a clear view of performance. Common examples include sales figures, revenue, website traffic, and customer growth, all of which help organisations track progress and evaluate success effectively.
2) Data Collection and Preparation
Once metrics are defined, the next step is collecting data from various sources. This data can come from different sources like company databases, financial records, or customer systems. Once collected, the data needs to be cleaned and organised. This means removing errors, fixing mistakes and making sure everything is in the same format.
3) Data Analysis
In this step, the data is examined and summarised. Simple calculations like totals, averages, and percentages are used to understand the data better. Tools like Excel, SQL or business intelligence software are often used here. For example, instead of looking at thousands of sales records, you can see a summary of monthly sales.
4) Data Segmentation
Segmentation involves dividing data into smaller, meaningful groups based on criteria such as age, location, or purchasing behaviour. This helps identify patterns within specific segments. For example, businesses can group customers to understand which segments generate the highest revenue, enabling more targeted and effective strategies.
5) Data Visualisation and Reporting
The final step is presenting the analysed data in a clear and accessible format using charts, graphs, dashboards, or reports. Visual representation makes complex data easier to understand. It also highlights trends and patterns quickly, ensuring insights can be effectively communicated and used for decision-making across the organisation.
Learn to analyse and interpret financial statements with the Strategic Business Reporting (SBR) Course – Register today!
Benefits of Descriptive Analytics
Descriptive Analytics offers several practical benefits that help businesses understand trends and gain clarity on past activities. It serves as a foundation for data-driven decision-making and supports continuous improvement. Let’s explore its key benefits below:
1) Simplifies the Data Analysis Process
One of the biggest benefits of Descriptive Analytics is that it is easy to use due to its simplicity. It does not require complex tools or advanced knowledge. Even individuals with basic data skills can use it to generate insights.
This makes it an ideal starting point for organisations to begin their Data Analysis journey, allowing them to build confidence before moving to advanced analytics techniques.
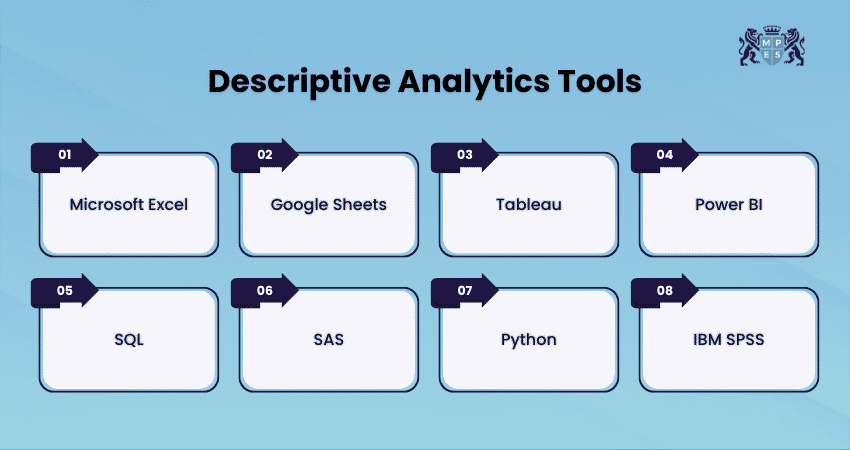
2) Provides Access to a Wide Range of Tools
There are many tools available for Descriptive Analytics. These include simple tools like Excel and more advanced tools like Power BI and Tableau. These tools make it easy to analyse and present data.
The availability of these tools makes it easy for organisations of all sizes to use Descriptive Analytics. Whether it is a small business or a large company, there are tools available to match different needs and budgets.
3) Enables Clear Insights into Business Performance
Descriptive Analytics is very useful for answering everyday business questions. It helps businesses know how they are performing and where they currently stand in terms of performance. It also makes it easier to identify areas that need improvement.
For example, it can show sales growth, user activity patterns or how well a marketing campaign worked. These insights help businesses make better decisions and improve performance.
4) Improves Data Understanding and Clarity
Descriptive Analytics presents the data in a way that is easy to understand. By organising information into charts, graphs and reports, it allows businesses to have a deep understanding of their data. This reduces confusion and makes it easier to interpret results accurately.
It also improves overall clarity by highlighting important information and removing unnecessary details. This ensures that everyone in the organisation has a clear understanding of the data.
Challenges of Descriptive Analytics
While Descriptive Analytics is useful for understanding past data, it also comes with certain challenges. Here are those challenges that you should know before using it:
1) Limited Insight as a Basic Tool
Descriptive Analytics focuses only on summarising historical data, which means it offers a basic level of insight. It does not provide deep insights, which means it may not be enough for complex problems. Businesses often need more advanced analytics methods to gain deeper insights and make strategic decisions.
2) Shows What Happened, Not Why it Happened
One of the biggest limitations of Descriptive Analytics is that it does not explain the reasons behind the results. It simply presents facts and figures without identifying the causes of those outcomes. For example, it may show a drop in performance, but it will not explain its reasons. To understand that, businesses need to use some other advanced analytics techniques.
3) May Track Incorrect Metrics
The effectiveness of Descriptive Analytics depends on the metrics being used. If the wrong metrics are selected, the insights generated may not be useful or relevant. Sometimes, businesses may focus on numbers that look impressive but do not actually support decision-making. This can lead to confusion and poor business choices.
4) Data Quality Issues Can Affect Accuracy
The quality of data is very important in Descriptive Analytics. If the data is incomplete, outdated, or incorrect, the results will also be unreliable. Poor data quality can cause misleading insights and wrong decisions. This is why it is important to clean, verify, and maintain data before analysing it.
Gain the confidence to handle high-level audit responsibilities with the Advanced Audit and Assurance (AAA) Course – Sign up soon!
Examples of Descriptive Analytics
Descriptive Analytics is widely used across different industries to understand past performance and identify patterns. Here are some common examples:
1) Sales Performance Analysis
Businesses use Descriptive Analytics to review past sales data and understand performance over time. It helps identify trends such as peak sales periods, top-performing products, and overall revenue growth. This allows companies to track progress and adjust their strategies accordingly.
2) Website and User Activity Tracking
Organisations analyse website data to understand user behaviour, such as page visits, time spent on pages, and bounce rates. This helps in identifying which pages perform well and where users lose interest, improving overall website performance.
3) Customer Behaviour Analysis
Descriptive Analytics helps businesses understand customer actions, such as purchase history, preferences, and engagement levels. This allows companies to segment customers and improve their marketing and service strategies.
4) Financial Reporting and Analysis
Companies use Descriptive Analysis to review financial data, including expenses, profits, and revenue trends. It helps in monitoring financial performance and ensuring better budgeting and planning.
5) Operational Performance Monitoring
Businesses analyse operational data to track efficiency, productivity, and workflow performance. This helps find areas where processes can be improved and ensures smoother operations.
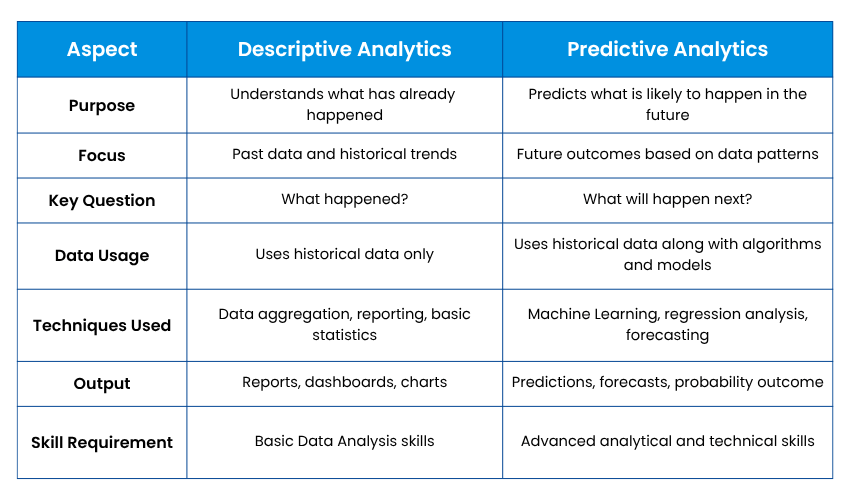
Descriptive Analytics vs Predictive Analytics
Descriptive Analytics and predictive analytics serve different purposes, although they are often used together. Descriptive Analytics focuses on summarising past data, while predictive analytics uses statistical models and Machine Learning (ML) to forecast future outcomes.
For instance, Descriptive Analytics might show that sales increased during the holiday season, while predictive analytics could forecast future sales trends based on historical patterns. The former provides context, while the latter offers foresight. However, both types are important for decision-making.
Conclusion
Descriptive Analytics is a simple yet effective way to understand what has already happened in a business. It provides a strong foundation for data-driven decision-making without requiring complex tools or advanced skills. For any business looking to make better use of its data, it becomes the ideal starting point to better understand its performance.
Build your strategic thinking and leadership abilities with ACCA Strategic Professional Training – Start now!
Frequently Asked Questions
Q. Is Descriptive Analytics Used in Big Data Analytics?
Yes, Descriptive Analytics is a key component of Big Data Analytics. It is often the first step in analysing large datasets, providing a summary of historical data before more advanced techniques like predictive or prescriptive analytics are applied.
Q. What Skills are Needed for Descriptive Analytics?
To work with Descriptive Analytics, individuals need basic Data Analysis skills, including knowledge of spreadsheets, data visualisation tools and statistical concepts. Familiarity with tools like Excel, SQL or Business Intelligence platforms can be helpful. Strong analytical thinking and attention to detail are also equally important.
Q. What is Descriptive Analytics in Business Analytics?
In business analytics, Descriptive Analytics refers to the process of analysing historical business data to understand past performance. It helps organisations track key metrics, monitor trends, and generate reports that support decision-making.